
tóng-àn:Sinh cosh tanh.svg

此 SVG 檔案的 PNG 預覽的大小:504 × 504 siōng-sò͘。 Kî-thaⁿ--ê kái-sek-tō͘: 240 × 240 siōng-sò͘ | 480 × 480 siōng-sò͘ | 768 × 768 siōng-sò͘ | 1,024 × 1,024 siōng-sò͘ | 2,048 × 2,048 siōng-sò͘.
Choân kái-sek-tō͘ (SVG ùng-giông, chék-cháung: 504 × 504 chuông-só, ùng-giông duâi-nâung:17 KB)
|
|
Che sī tùi Wikimedia Commons ín--lâi ê chi̍t hūn tóng-àn. I tī hia ê kì-su̍t-ia̍h téng-bīn ê chu-sìn hián-sī ùi ē-té. |
Khài-iàu
| Soat-bêng |
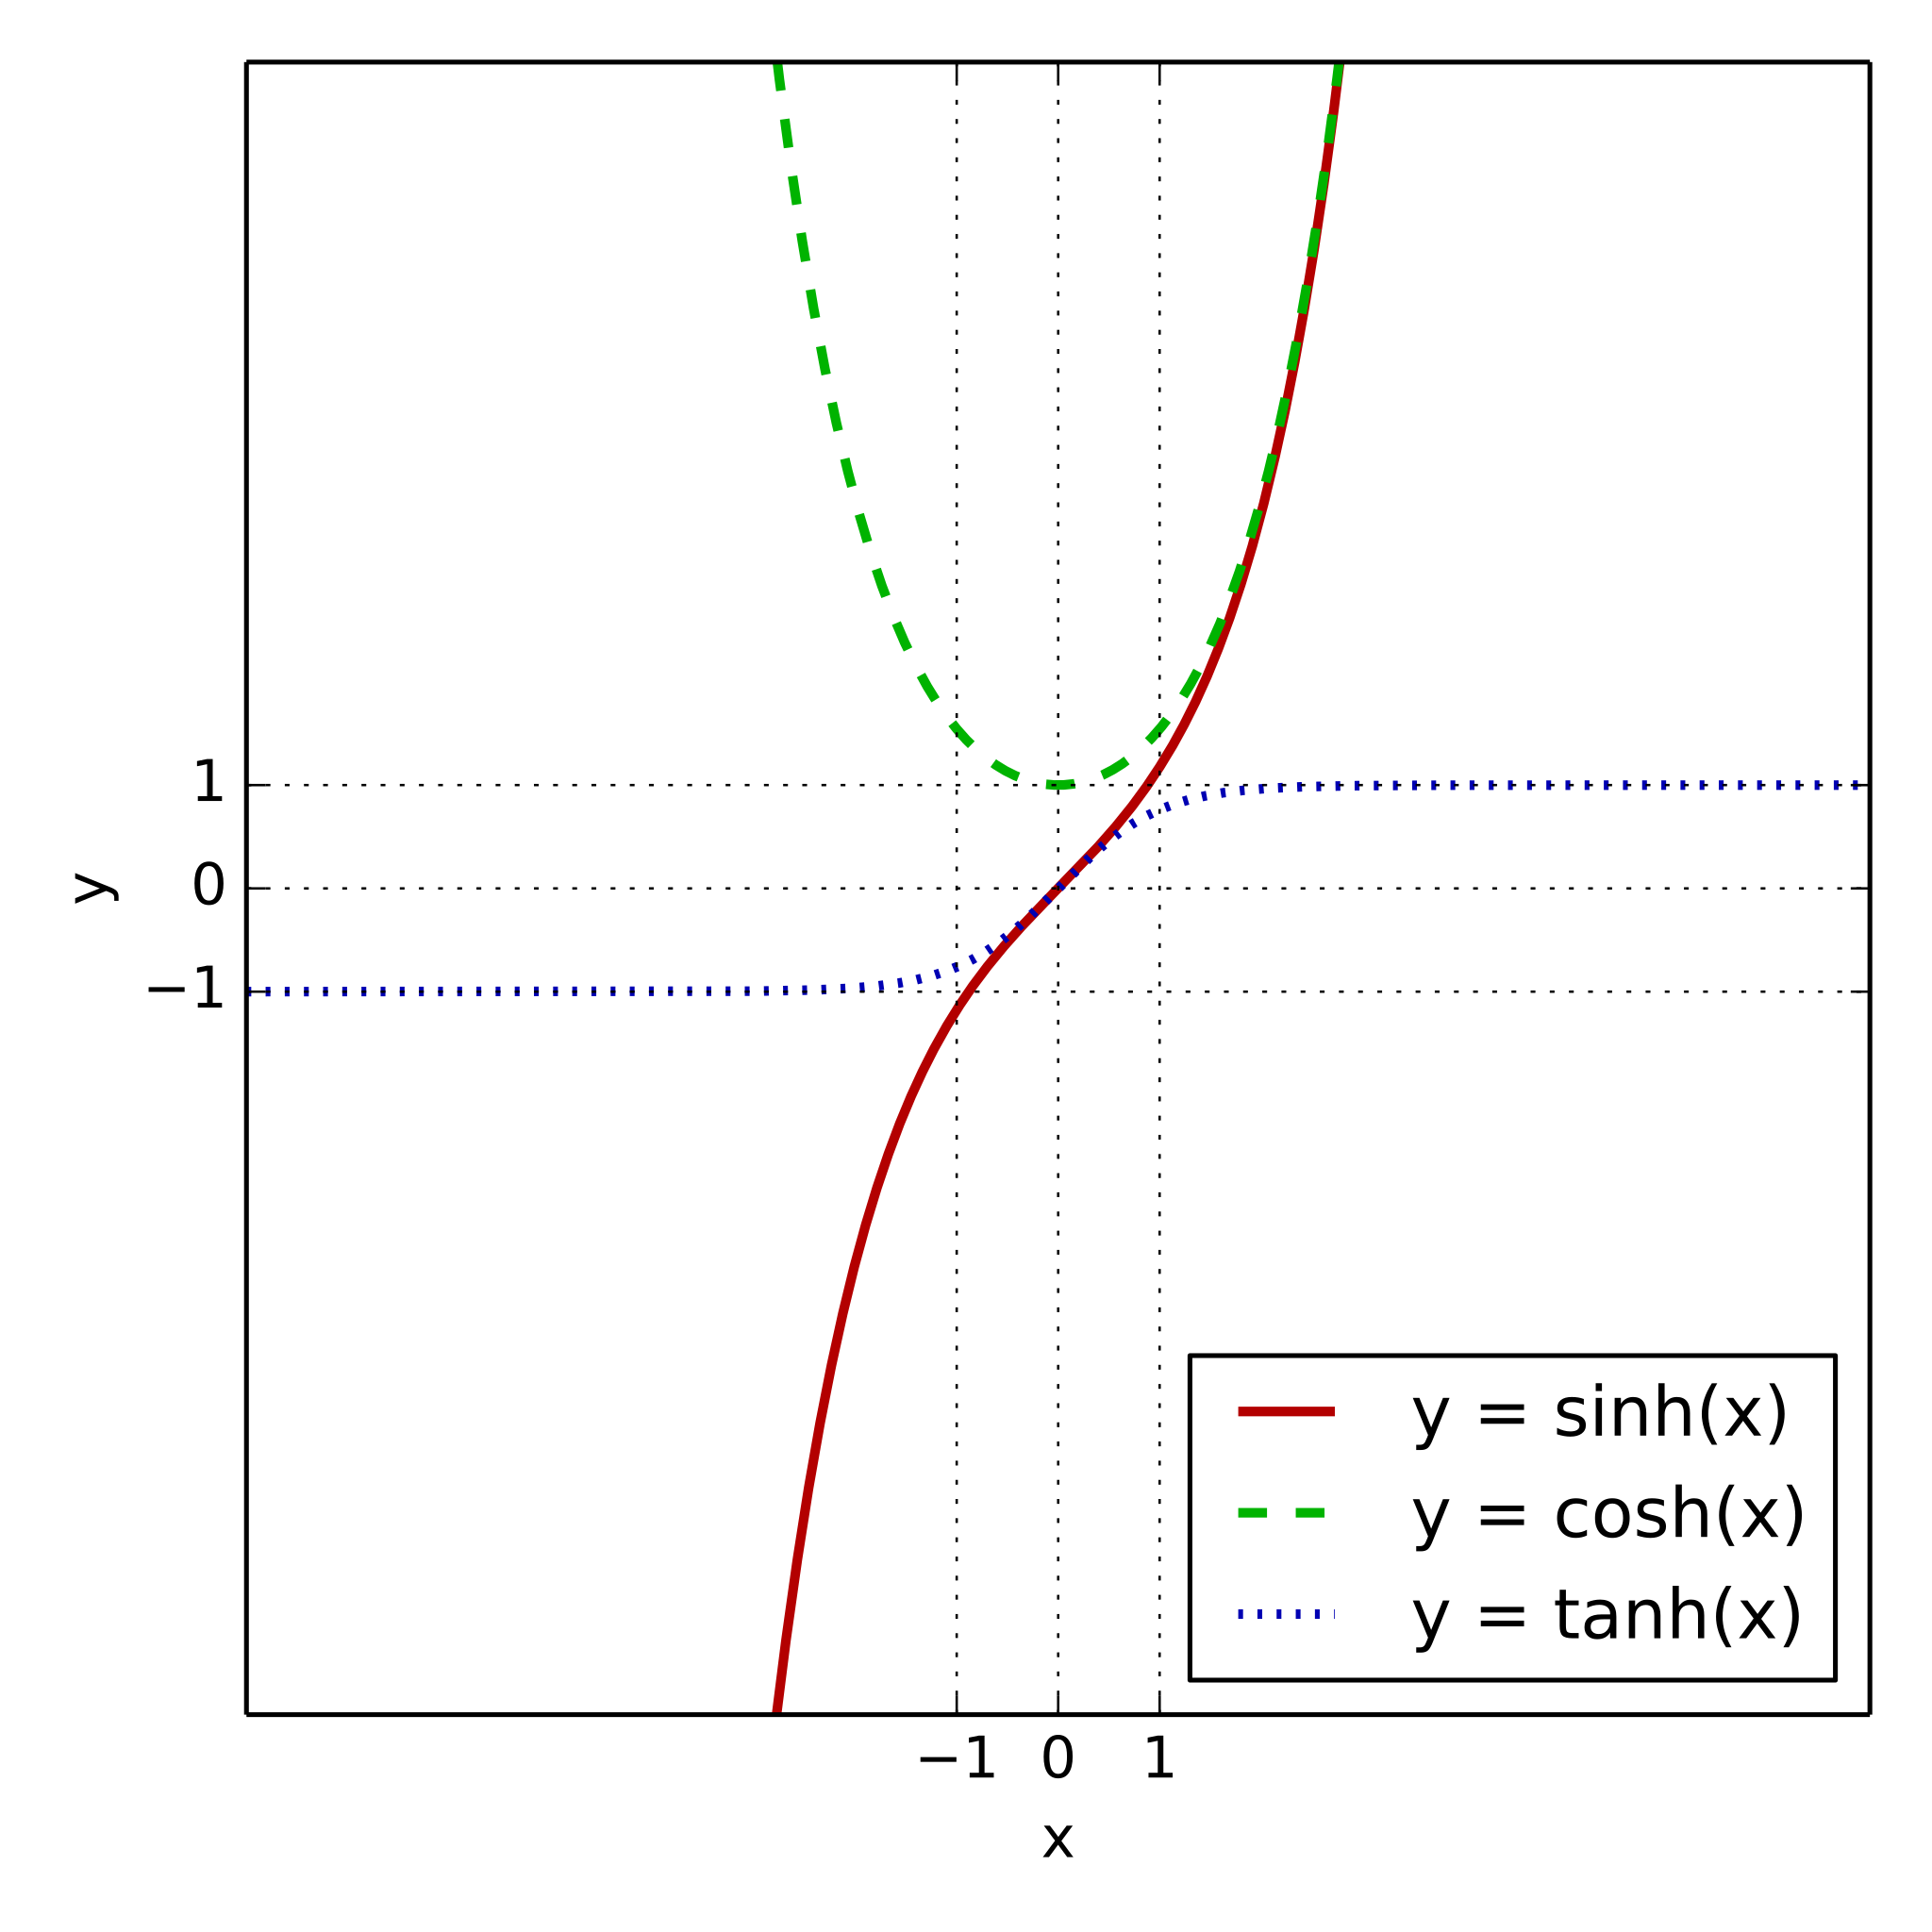
The hyperbolic sine (red), hyperbolic cosine (green) and hyperbolic tangent (blue) graphed on the same axes. Replaces en:Image:sinh cosh tanh.png
|
| Ji̍t-kî | |
| Chhut-chhù | Ka-tī chò--ê |
| Chok-chiá | 英文Wikipedia的Fylwind |
| SVG開發 | 本向量圖形使用Matplotlib創作。 |
| Goân-sú-bé | Python codeimport numpy as np
import matplotlib.pyplot as plt
lim = 8
size = 5.6
fig, ax = plt.subplots(figsize=(size, size))
xs = np.linspace(-lim, lim, 1000)
ax.plot(xs, np.sinh(xs), label="y = sinh(x)",
color="#b30000", linestyle="-", linewidth=2)
ax.plot(xs, np.cosh(xs), label="y = cosh(x)",
color="#00b300", linestyle="--", linewidth=2)
ax.plot(xs, np.tanh(xs), label="y = tanh(x)",
color="#0000b3", linestyle=":", linewidth=2)
ax.set_xlim(-lim, lim)
ax.set_ylim(-lim, lim)
ax.set_xticks([-1, 0, 1])
ax.set_yticks([-1, 0, 1])
ax.set_xlabel("x")
ax.set_ylabel("y")
ax.grid("on")
ax.legend(loc="lower right")
fig.tight_layout()
fig.savefig("sinh_cosh_tanh.svg", transparent=True)
|
Siū-khoân
| 我,此作品的版權所有人,釋出此作品至公共領域。此授權條款在全世界均適用。 這可能在某些國家不合法,如果是的話: 我授予任何人有權利使用此作品於任何用途,除受法律約束外,不受任何限制。 |
原始上傳日誌
The original description page was here. All following user names refer to en.wikipedia.
- 2006-03-14 10:22 Ktims 1600×1200×0 (8934 bytes) The hyperbolic sine (red), hyperbolic cosine (green) and hyperbolic tangent (blue) graphed on the same axes.
- 2006-03-14 10:21 Ktims 1600×1200×0 (8965 bytes) The hyperbolic sine (red), hyperbolic cosine (green) and hyperbolic tangent (blue) graphed on the same axes.
- 2006-03-14 10:15 Ktims 1600×1200×0 (8967 bytes) The hyperbolic sine (red), hyperbolic cosine (green) and hyperbolic tangent (blue) graphed on the same axes.
- 2006-03-14 10:15 Ktims 1600×1200×0 (8980 bytes) The hyperbolic sine (red), hyperbolic cosine (green) and hyperbolic tangent (blue) graphed on the same axes.
- 2006-03-14 10:14 Ktims 1600×1200×0 (8902 bytes) The hyperbolic sine (red), hyperbolic cosine (green) and hyperbolic tangent (blue) graphed on the same axes.
Tóng-àn le̍k-sú
Chhi̍h ji̍t-kî/sî-kan, khoàⁿ hit sî-chūn--ê tóng-àn.
| Ji̍t-kî/Sî-kan | 細張圖 | 寸尺 | Iōng-chiá | Chù-kái | |
|---|---|---|---|---|---|
| hiān-chāi | 2016-nî 3-goe̍h 10-ji̍t (pài-sì) 23:27 | | 504 × 504(17 KB) | Fylwind | Make asymptotics more evident. |
| 2007-nî 2-goe̍h 6-ji̍t (pài-jī) 00:39 |  | 1,600 × 1,200(13 KB) | Alejo2083 | dashed lines | |
| 2007-nî 2-goe̍h 6-ji̍t (pài-jī) 00:31 |  | 1,600 × 1,200(9 KB) | Alejo2083 | {{Information |Description=The hyperbolic sine (red), hyperbolic cosine (green) and hyperbolic tangent (blue) graphed on the same axes. Replaces en::Image:sinh cosh tanh.png == Instructions == Generated with the following en:gnuplot source. XM |
Iáⁿ-siōng liân-kiat
Í-hā ê ia̍h liân kàu chit ê iáⁿ-siōng:
tóng-àn hō͘ lâng sái--ê chōng-hóng
Ē-kha--ê kî-thaⁿ wiki ēng tio̍h chit--ê tóng-àn:
- ar.wikipedia.org hō͘ lâng ēng--ê chêng-hêng
- az.wikipedia.org hō͘ lâng ēng--ê chêng-hêng
- bg.wikipedia.org hō͘ lâng ēng--ê chêng-hêng
- bs.wikipedia.org hō͘ lâng ēng--ê chêng-hêng
- ca.wikipedia.org hō͘ lâng ēng--ê chêng-hêng
- cs.wikipedia.org hō͘ lâng ēng--ê chêng-hêng
- cv.wikipedia.org hō͘ lâng ēng--ê chêng-hêng
- el.wikipedia.org hō͘ lâng ēng--ê chêng-hêng
- en.wikipedia.org hō͘ lâng ēng--ê chêng-hêng
- en.wikibooks.org hō͘ lâng ēng--ê chêng-hêng
- eo.wikipedia.org hō͘ lâng ēng--ê chêng-hêng
- et.wikipedia.org hō͘ lâng ēng--ê chêng-hêng
- eu.wikipedia.org hō͘ lâng ēng--ê chêng-hêng
- fa.wikipedia.org hō͘ lâng ēng--ê chêng-hêng
- ga.wikipedia.org hō͘ lâng ēng--ê chêng-hêng
- hi.wikipedia.org hō͘ lâng ēng--ê chêng-hêng
- hr.wikipedia.org hō͘ lâng ēng--ê chêng-hêng
- hu.wikipedia.org hō͘ lâng ēng--ê chêng-hêng
- id.wikipedia.org hō͘ lâng ēng--ê chêng-hêng
- is.wikipedia.org hō͘ lâng ēng--ê chêng-hêng
- km.wikipedia.org hō͘ lâng ēng--ê chêng-hêng
- ko.wikipedia.org hō͘ lâng ēng--ê chêng-hêng
- ko.wiktionary.org hō͘ lâng ēng--ê chêng-hêng
- mk.wikipedia.org hō͘ lâng ēng--ê chêng-hêng
- nn.wikipedia.org hō͘ lâng ēng--ê chêng-hêng
- pl.wikipedia.org hō͘ lâng ēng--ê chêng-hêng
- ro.wikipedia.org hō͘ lâng ēng--ê chêng-hêng
- simple.wikipedia.org hō͘ lâng ēng--ê chêng-hêng
- si.wikipedia.org hō͘ lâng ēng--ê chêng-hêng
- sq.wikipedia.org hō͘ lâng ēng--ê chêng-hêng
- sv.wikipedia.org hō͘ lâng ēng--ê chêng-hêng
- ta.wikipedia.org hō͘ lâng ēng--ê chêng-hêng
- tr.wikipedia.org hō͘ lâng ēng--ê chêng-hêng
- uk.wikipedia.org hō͘ lâng ēng--ê chêng-hêng
- uz.wikipedia.org hō͘ lâng ēng--ê chêng-hêng
- vi.wikipedia.org hō͘ lâng ēng--ê chêng-hêng
- wuu.wikipedia.org hō͘ lâng ēng--ê chêng-hêng
- zh-yue.wikipedia.org hō͘ lâng ēng--ê chêng-hêng
- zh.wikipedia.org hō͘ lâng ēng--ê chêng-hêng