tóng-àn:Normal distribution and scales.gif

Seng khoàⁿ chiàm-liōng: 800 × 458 siōng-sò͘. Kî-thaⁿ--ê kái-sek-tō͘: 320 × 183 siōng-sò͘ | 640 × 366 siōng-sò͘ | 1,200 × 687 siōng-sò͘.
Choân kái-sek-tō͘ (1,200 × 687 siōng-sò͘ , tóng-àn chiàm-liōng: 39 KB, MIME luī-hêng: image/gif)
Tóng-àn le̍k-sú
Chhi̍h ji̍t-kî/sî-kan, khoàⁿ hit sî-chūn--ê tóng-àn.
| Ji̍t-kî/Sî-kan | 細張圖 | 寸尺 | Iōng-chiá | Chù-kái | |
|---|---|---|---|---|---|
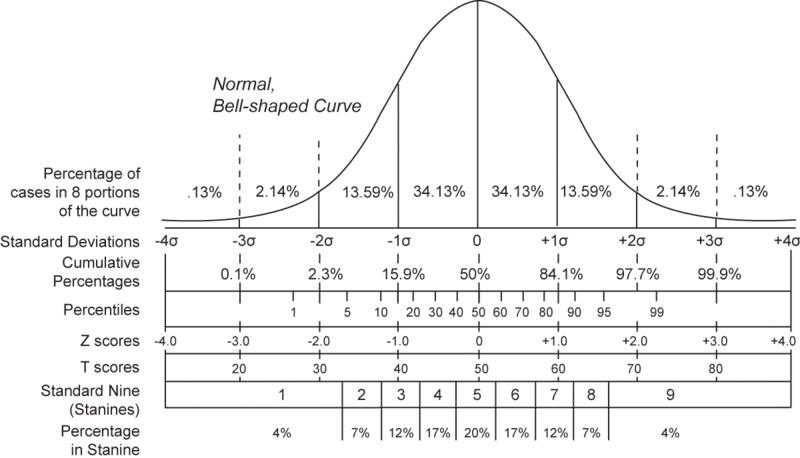
| hiān-chāi | 2006-nî 3-goe̍h 20-ji̍t (pài-it) 18:12 |  | 1,200 × 687(39 KB) | Maksim | La bildo estas kopiita de wikipedia:en. La originala priskribo estas: == Summary == A chart comparing the various grading methods in a normal distribution. Includes: Standard deviations, cummulative precentages, percentile equivalents, Z-scores, T-scores |
Iáⁿ-siōng liân-kiat
Í-hā ê ia̍h liân kàu chit ê iáⁿ-siōng:
tóng-àn hō͘ lâng sái--ê chōng-hóng
Ē-kha--ê kî-thaⁿ wiki ēng tio̍h chit--ê tóng-àn:
- ar.wikipedia.org hō͘ lâng ēng--ê chêng-hêng
- ca.wikipedia.org hō͘ lâng ēng--ê chêng-hêng
- de.wikipedia.org hō͘ lâng ēng--ê chêng-hêng
- dv.wikipedia.org hō͘ lâng ēng--ê chêng-hêng
- en.wikipedia.org hō͘ lâng ēng--ê chêng-hêng
- eo.wikipedia.org hō͘ lâng ēng--ê chêng-hêng
- es.wikipedia.org hō͘ lâng ēng--ê chêng-hêng
- fr.wikipedia.org hō͘ lâng ēng--ê chêng-hêng
- gl.wikipedia.org hō͘ lâng ēng--ê chêng-hêng
- he.wikibooks.org hō͘ lâng ēng--ê chêng-hêng
- he.wiktionary.org hō͘ lâng ēng--ê chêng-hêng
- ko.wikipedia.org hō͘ lâng ēng--ê chêng-hêng
- mr.wikipedia.org hō͘ lâng ēng--ê chêng-hêng
- mwl.wikipedia.org hō͘ lâng ēng--ê chêng-hêng
- pl.wikipedia.org hō͘ lâng ēng--ê chêng-hêng
- pl.wiktionary.org hō͘ lâng ēng--ê chêng-hêng
- pt.wikipedia.org hō͘ lâng ēng--ê chêng-hêng
- pt.wikiquote.org hō͘ lâng ēng--ê chêng-hêng
- ru.wikipedia.org hō͘ lâng ēng--ê chêng-hêng
- simple.wiktionary.org hō͘ lâng ēng--ê chêng-hêng
- tg.wikipedia.org hō͘ lâng ēng--ê chêng-hêng
- zh.wikipedia.org hō͘ lâng ēng--ê chêng-hêng


